Triphasic BBT Charts and Pregnancy
A triphasic BBT chart shows up in only about 12.5% of pregnancy cycles, versus 4.5% of non-pregnant cycles -- so it's a mildly encouraging sign if you see one, but most pregnancies never show a triphasic pattern at all.
The different types of BBT patterns
If you're charting your basal body temperature (BBT), you're probably familiar with three general patterns:
- Monophasic (one phase): no shift in temperature before vs. after ovulation. This usually shows up in anovulatory cycles — cycles where you didn't ovulate.
- Biphasic (two phases): your typical ovulatory chart. Temperatures fluctuate a bit, but are generally low before ovulation and higher after.
- Triphasic (three phases): similar to biphasic, but with a third shift — low before ovulation, higher after, and even higher again after implantation.
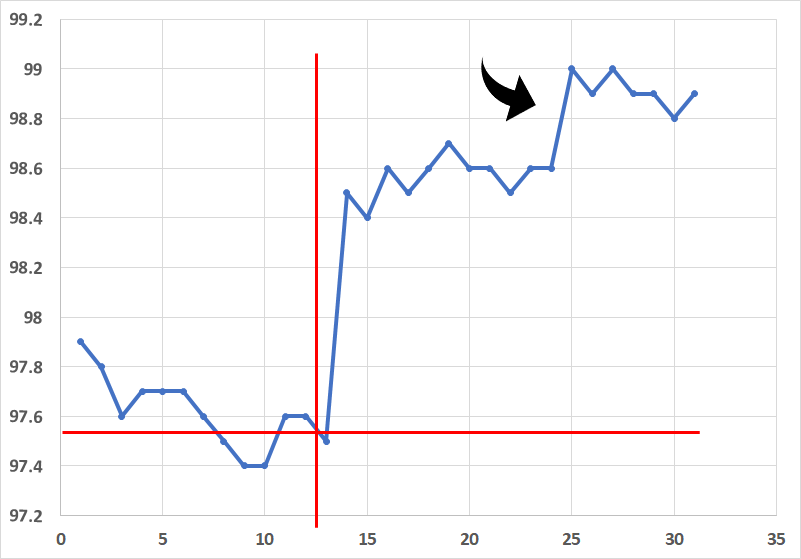
Triphasic patterns and hormones
There's a feedback loop between hCG (the pregnancy hormone secreted after implantation) and progesterone, which is what drives your temperature up. These hormones create the changes you see when charting, but that third jump — the one tied to implantation — is surprisingly hard to spot. An analysis of nearly 150,000 charts from Fertility Friend found a triphasic pattern in only 12.5% of pregnancy charts. On average, that temperature rise happens around 9 days after ovulation — right around the average day of implantation.
Not just when you're pregnant
Here's the catch: 12.5% doesn't tell us much without a comparison. Of regular (non-pregnant) cycles, only 4.5% showed a triphasic pattern — a meaningful difference, but not a definitive one. You can't conclude a triphasic pattern means you're pregnant, since it still shows up in cycles that don't result in pregnancy. And just as importantly, not seeing one doesn't mean you're not pregnant — the majority of women who do conceive have a completely ordinary biphasic chart.
What actually causes the third shift, chart-wise
The leading explanation is simple: after implantation, the newly formed placenta starts producing hCG, which in turn signals the corpus luteum to keep pumping out progesterone rather than winding down like it would in a non-pregnant cycle. That sustained (and sometimes slightly higher) progesterone level is what nudges your temperature up a second time. It's a real physiological mechanism — it's just not consistent enough, chart to chart, to be a reliable pregnancy test on its own.
What to actually do with this information
- Treat a triphasic shift as a mildly encouraging pattern, not a confirmation — a pregnancy test is still the only way to know for sure.
- Don't lose hope if your chart stays biphasic. Most pregnant women's charts never show the third shift.
- Keep charting consistently through the two-week wait so you have a clean baseline to compare against, whatever pattern shows up.
If you're taking your temperature but not getting consistent readings, it's worth checking your setup: a reliable basal thermometer, taken at roughly the same time each morning before getting out of bed, makes a much bigger difference than most people expect.
Common questions
Does a triphasic chart mean I'm definitely pregnant?
No. Triphasic charts show up in some non-pregnant cycles too (about 4.5% of them), so it's a hopeful sign, not a confirmation.
Does NOT seeing a triphasic pattern mean I'm not pregnant?
Not at all. The vast majority of women who do conceive have a plain biphasic chart, with no visible third temperature shift.